Publishers who start to get serious about monetizing their traffic eventually bump into header bidding sooner or later.
The most popular way of implementing it from scratch is via Prebid or also known as prebid.js, one of the open-source frameworks available for anyone to use. It already comes with adapters, demand partners, modules that can help you create your own header bidding wrapper or start using header bidding. Unfortunately, it does require a bit of technical know-how to set it up properly on your own, which is something that not all publishers are comfortable doing. Some dread having to face and edit the numerous lines of code that make up their domain!
The other route of implementing header bidding is through proprietary wrappers from ad technology partners like us at Monetizemore. This way, you won’t have to stress about how you can go about implementing header bidding on your site and can start using it with little to no hassle on your part. With Pubguru Header Bidding, you can maximize the value of your impressions while enjoying one of the most advanced header bidding wrappers available on the market.
Once you’re live with Monetizemore’s Pubguru Header Bidding solution, you’ll be provided access to your Pubguru Dashboard. Our self-serve dashboard solution not only provides you reporting data for your ad revenue but also other advanced reports you can use to maximize your ad revenue performance and strategies you’re implementing.
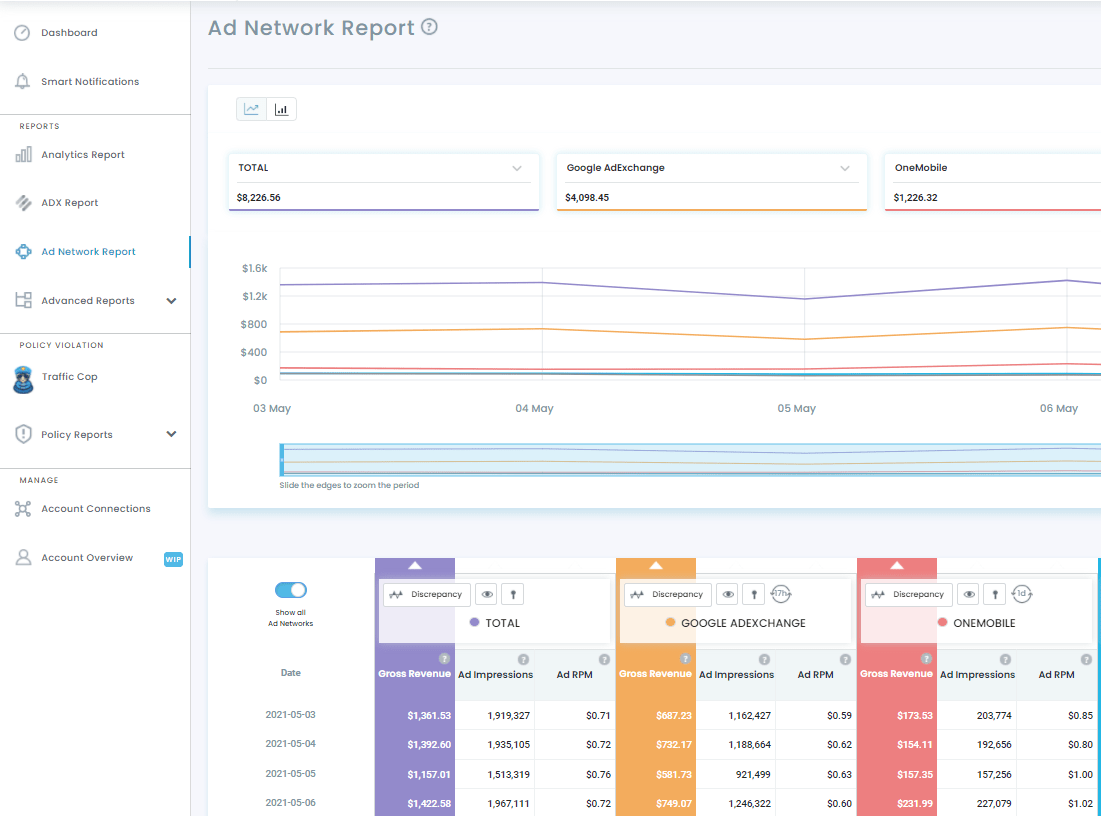
Sample of what you’ll be able to see once you’re logged in (this one is for Ad Network Reports)
Under the Reports section, which you can access on the left-hand side of your dashboard, you can find reports for Analytics, Ad Exchange, Ad Networks Report, and Advanced Reports. To access reports specific to Header Bidding, you’ll want to focus on the Ad Network Report section, which provides you the data of how all header bidding partners running on your site are performing.
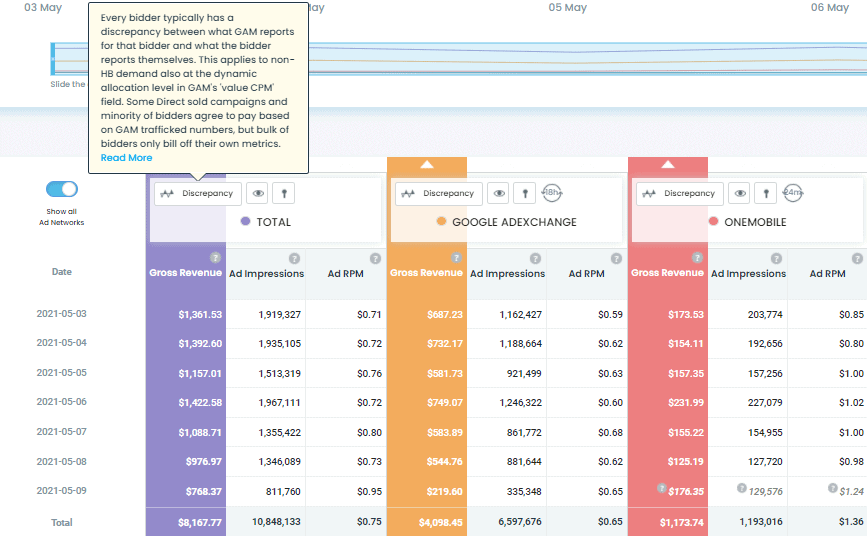
Hovering on the icons shows you a brief overview of what they’re for, as well as helpful article links that better explain them.
The Ad Networks Report section shows you the total as well as the individual performance of each bidder competing for your inventory. On the upper right hand side of the interface, you’ll be able to set the Date Range for the report and show you the performance for your chosen dates. If you hover on the icons, a bubble box will pop up showing you a brief description regarding what it’s for and provide helpful article links if available. As you can see, there are three icons on top of each bidder column or the total column. Two of them are more or less for displaying or enabling the bidders to show up on the graph displayed above, while the most notable one is probably the Discrepancy button/section, where you can see the discrepancy numbers between GAM (Google Ad Manager) and your chosen bidder.
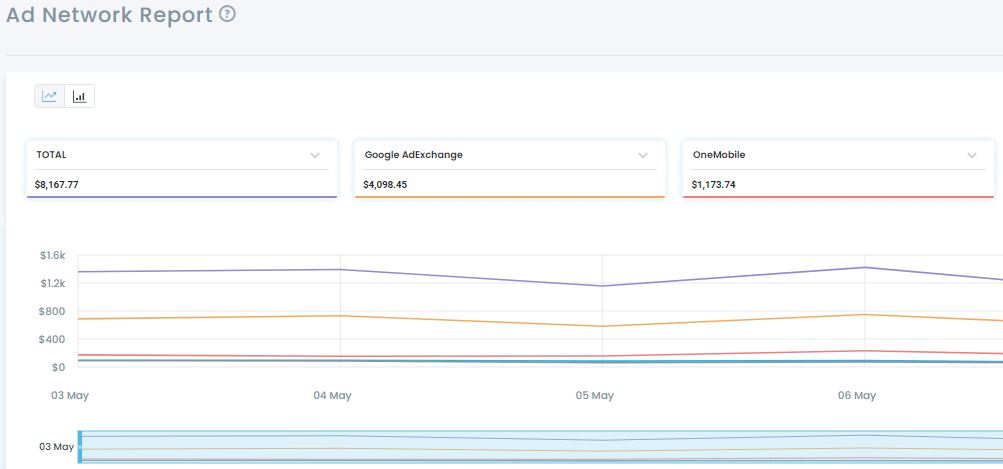
Graph provided in the Ad Network Report section
For the more visual ones out there, a graph is provided directly above your daily numbers. All active or selected bidders (which you can select/deselect through the eye icon at the right side of the Discrepancy button) will be displayed on the graph, which you can also change to a bar chart or graph if you prefer. All active partners or bidders will be displayed by default and can be deselected or singled out through the two icons beside Discrepancy at the bottom.
Not only is PubGuru Header Bidding easy to get started with, but you also get access to our PubGuru ad optimization dashboard with loads of features for optimizing your ad revenue! Are you ready to maximize your ad revenue? Sign up for PubGuru Header Bidding today!


10X your ad revenue with our award-winning solutions.