This post was most recently updated on September 6th, 2021
There’s been an increase in requests from publishers regarding their page load speed and the general behavior of their sites. In today’s post, we will look at some of the questions publishers have been bringing up, and later we will show you how to make your own reports, and better assess your page load situation.
It’s important to understand that the final behavior of a site is the result of several factors: technology used to build the page, how many elements are shown on the site, how those elements are stored, calculations made at runtime, etc. Reporting tools (such as LightHouse, which we will discuss later) will pinpoint these issues. Note that these problems are unrelated to our code since they are a consequence of how the site is built.
The higher the number of ad units on a page, the more elements that need to be loaded, so there is always a tradeoff between page speed and revenue that needs to be considered. Publishers need to be aware of this at all times. Our code doesn’t impact significantly on site performance. The MonetizeMore ad script runs asynchronously, meaning that, while the header bidding process is running, the rest of the site continues to load as it would without our code. When running Header bidding, it is inevitable for the ad load script to delay ad render until the bidding timeout is reached, another tradeoff that needs to be addressed. The default recommended timeout is 2000ms for striking a healthy balance between page load speed and good Header Bidding fill rates. Lowering this timeout might help with reducing the load time, only if the page is loading up faster than the timeout being set. The lowering of your header bidding timeout increases the chances where the header bidding auction might end before all the configured bidders return their final bids.
We will be using the Publisher ads audits for Lighthouse moving forward, and you can find it here: https://developers.google.com/publisher-ads-audits
Even though our script may not be the main culprit in page performance, page performance does impact traffic, and so it becomes an important issue for us. Make your own assessment of the site, and try to address the suggestions/warnings.
1.- Open the target webpage
2.- Right-click and select Inspect

3.- Among the dev tools, look for the last one, called Audits

4.- Select relevant categories and click “Generate report”. After several refreshes of the site, a report will be generated and shown.

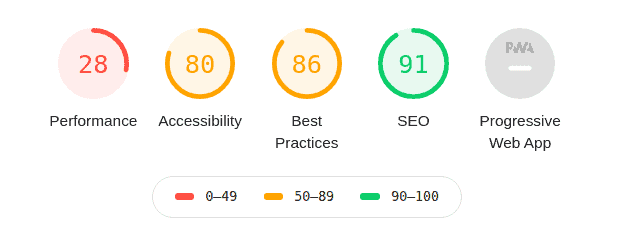
You will be shown several categories in which the page was evaluated:
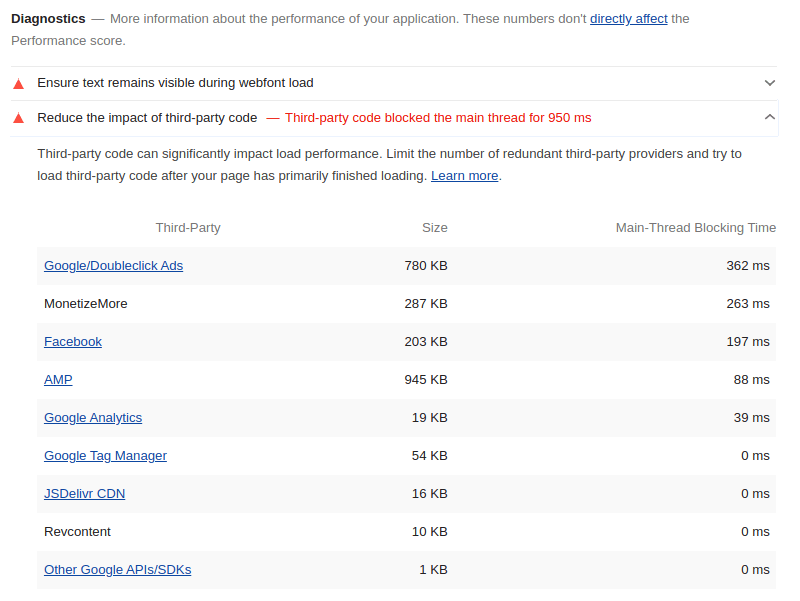
Most of this information is pretty straightforward. One that we should pay close attention to is performance -> Diagnostics, where we can see the performance of js codes, and in particular, ours.

In the picture above (Diagnostics -> Reduce the impact of third-party code), we see that our code blocks less than a third of a second in the main thread (the thread that is responsible for loading the page). None of these codes are blocking the main thread a lot, but the whole group of third-party codes uses an entire second of the main thread, which is ultimately what the users experience.

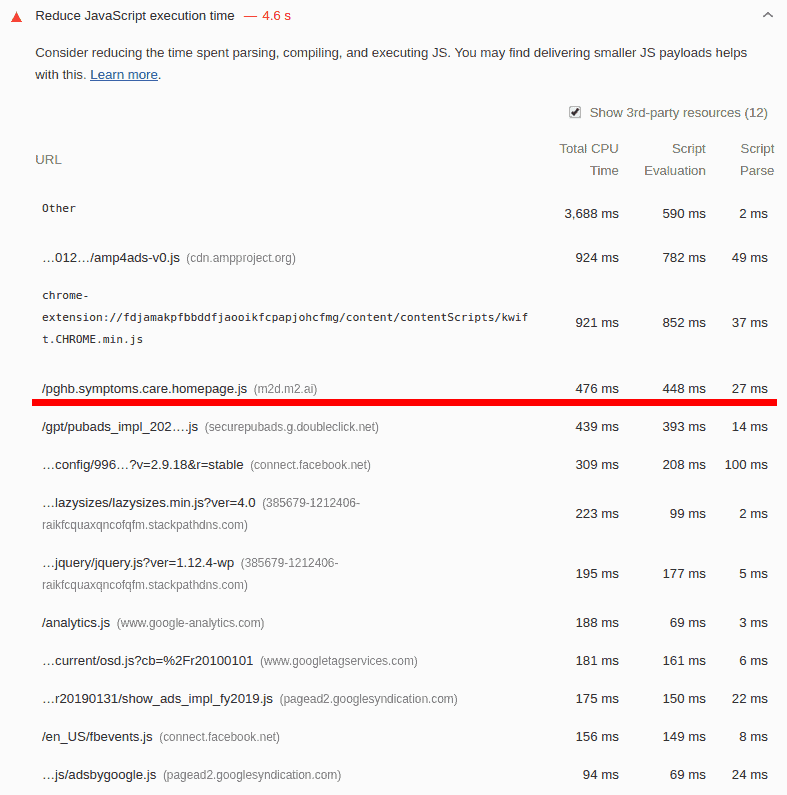
In the picture above (Diagnosis -> Reduce JavaScript execution time), we see that our code falls in line with the rest of the codes in execution time. Even if the execution time was higher, this is being done in another thread asynchronously, so it doesn’t impact performance.
Other, more technical suggestions can be:
Need more help? Sign up for a Professional account at MonetizeMore today!
10X your ad revenue with our award-winning solutions.