This post was most recently updated on December 18th, 2024
Ad revenue for apps isn’t one-size-fits-all. It depends heavily on:
Here are MonetizeMore’s eCPMs and RPM estimates (revenue per mille) to give you a clearer picture:
| Platform | Ad Format | eCPM (Estimated) | RPM (Estimated) | Notes |
|---|---|---|---|---|
| iOS | Banner | $0.50 – $2.50 | $0.25 – $1.25 | Poorest earning potential, good for high-traffic apps |
| iOS | Interstitial | $3.00 – $8.00 | $1.50 – $4.00 | Shown between screens, moderate app ad revenue |
| iOS | Rewarded Video | $10.00 – $30.00 | $5.00 – $15.00 | High user engagement, highest earning potential especially for gaming |
| Android | Banner | $0.25 – $1.50 | $0.12 – $0.75 | Lower eCPMs than iOS |
| Android | Interstitial | $1.50 – $5.00 | $0.75 – $2.50 | Similar to iOS but generally lower revenue |
| Android | Rewarded Video | $5.00 – $20.00 | $2.50 – $10.00 | Still strong app ad revenue, but lower than iOS counterparts |
Example:
A gaming app on iOS with 100,000 daily active users showing rewarded video ads could potentially generate:
-100,000 users * 0.10 videos per user * $20.00 eCPM = $200,000 per day (potentially!).

Ad revenue is the income earned by apps via in-app advertising. Ad views multiplied by eCPM yield app ad income.
ARPDAU, ARPU, and ARPPU are among the app metrics used by developers to track ad income. In addition to these signs, app developers employ reporting tools to differentiate between mobile video ad revenue as well as rewarded video ad revenue when deciding how to monetize their apps.
App developers must establish a solid ad monetization plan in order to maximize app ad revenue. Ad revenue can be increased by strategically placing high-performing types of ads, such as rewarded video advertisements and playable commercials, at high-converting stages in the app cycle.
Apps have the potential to generate millions of dollars in income each year. However, the majority of apps that achieve this are rather few in number. The bulk of the apps are flops that don’t actually make money whatsoever.
So, it’s an immensely tough exercise to establish an estimate on how much money an app can make given the big number of applications and the huge variety in the amount of cash they achieve to bring in for their publishers.
Apps ranked in the top 200 on the app store earn an average of $82,500 every day. When we broaden that range and look at the income numbers for the top 800 apps, the daily income falls to roughly $3,500.
This disparity is also evident across genres; for example, gaming apps earn roughly $22k per day, whereas entertainment applications earn only $3090. Having said that, there is no universal answer to how much income an app can generate.
Related Read: https://www.monetizemore.com/blog/make-money-mobile-app-monetization/
As part of an app’s monetization strategy, mobile game ad revenue refers to money made by in-game advertisements including such rewarded ads, offer walls, interstitials, and playable ads instead of in-app purchases.
The revenue from gaming ads is estimated by multiplying the number of impressions an ad receives on an ad platform by the eCPM. Ultimately, mobile game advertising revenue has shown to be quite profitable, with mobile games, and is on track to generate $39.8 billion in advertising money alone.
Subscription apps are yet another excellent way to make money via in-app purchases. Tinder is the greatest example of a comparable money-making app. Even though the Tinder app is available for free download, users must pay for features such as unrestricted swipes. This functionality provides users with an infinite number of possibilities to find a match.
Furthermore, Tinder’s “Passport” add-on enables people to connect with users in different regions, whereas “Boost” allows users to appear at the top of that list in front of nearby Tinder users. These in-app services, which were only accessible to the public if they paid for them, earned approximately $407.4 million in revenue.
The proportion of money an app makes for each ad is determined by numerous factors like the app’s genre, the ad unit, the user’s demography, etc. It is estimated that the average income for rewarded video advertisements in the United States is $0.02 per impression. The overall payout per completion for interstitials is $0.16.
In terms of genre, casino and action games provide the greatest revenue per rewarded video ad, while hyper-casual and casual games generate the least although they compensate for the revenue with a higher volume of impressions.
The sort of ad unit will have an impact on revenue. One or more ad units may be used in a mobile app. Too many units on a mobile device may limit income and drive customers away. Finding the correct balance of ad units is crucial for increasing income while maintaining the app’s functionality and purpose.
Most mobile apps serve to display and video ad units. The banners that appear on the screen are known as display advertisements. The placement varies, although it is normal for a bar to take up just under one-third of the upper or bottom screen. Full-screen pop-up ads that last a few seconds or play a video are also employed.
A CPM pricing model determines revenue. CPM is an abbreviation for cost per mille (thousand) initial impressions. The worth of impressions varies depending on the people and market.
A finance sector app is more likely to have a greater CPM value than one with a low price point and tight margin offering.
The revenue calculation is just the number of views multiplied by the CPM and divided by 1,000. If you receive 10,000 impressions and your CPM price for an ad unit is $8, your earning will be $8*(10,000/1000) = $80.
The revenue potential for mobile app advertising is practically limitless, as long as marketers are ready to spend and consumers interact with your app. When your customer base expands, so does your revenue. The number of downloads has no direct relationship with advertising revenue. Users must continue to engage with the app and stay on the page to genuinely make cash.
Developing apps that add value and maintain users will result in increased advertiser value and income over time. Evaluate your potential revenue by investigating average CPM values in your sector and comparing them to your expected download and impression figures. It is tough to predict impressions for a new app, however, one that has been tested and has statistics exhibiting visitor trends over time can accurately estimate revenue possibilities based on the current traffic conditions.
CPM stands for cost per mille (1,000) impressions. Other measures are often used to assess outcomes and costs. The ad or organization operating on their behalf uses a cost per click (CPC) and cost per acquisition (CPA) to define campaign Key Performance Indicators or KPIs.
Monitoring CPC or CPA is done routinely on the ad server-side because clicks and purchases or conversions are recorded when a customer clicks through from the ad to an external website. Your compensation is normally calculated by measuring the ad clicks from your site as the publisher.
The quantity of real visitors who make impressions on the adverts delivered to your site determines revenue. The CPM is decided upfront in a straight buy ecosystem.
The CPM will change in an auction system, and your earnings will be less static. When the desire for relevant topic matters pushes up ad pricing, this might work to your benefit.
Finance and other high-value themes command greater CPMs and income prospects, but getting clicks is also quite competitive. As a publication, you will be paid by your ad manager, but the CPM will not always be displayed. This figure is calculated by comparing your traffic against the payment.
Retrieve your website visitor numbers for the same time frame as your compensation. The revenue is tied to a specified time frame, and the dates must coincide. You should run a monthly statement to track seasonal trends and compute your average CPM for each quarter and the entire year.
Divide your total profits by the number of visits to your website or app during the time period. The CPM you are getting is calculated by multiplying the result by 1,000. If your ad server reports the CPM and you understand the impressions, just divide them by 1,000 and multiply by the CPM to get your current revenue. This method is useful for tracking revenue prior to the official report and payment.
The most profitable ad formats vary by app genre, as different types of apps engage users in distinct ways. Here’s a breakdown of the most effective ad formats for various app categories:

The mobile gaming ad revenue is projected to reach $177 billion in 2024, with in-app purchases contributing significantly to this figure. The global gaming market value is expected to be around $240 billion in the same year, indicating a robust monetization landscape for gaming apps.

The social media advertising market is expected to grow significantly, with projections indicating that mobile ad spending will reach approximately $216.4 billion in 2024. This includes substantial contributions from social media platforms that rely heavily on native and banner ads.
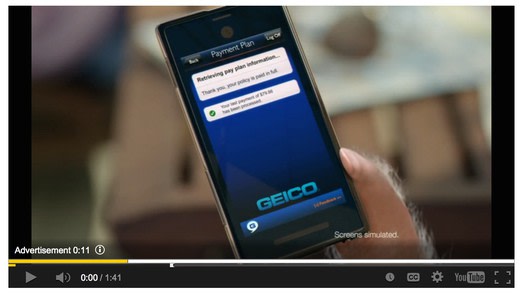
The video streaming market is part of the broader digital ad market, which is forecasted to increase to $216.4 billion in 2024. Streaming apps can expect significant revenue from video ads, particularly as user engagement with video content continues to rise.

The e-commerce mobile app market is also part of the growing mobile ad ecosystem, with overall mobile commerce expected to reach around $4.5 trillion globally by 2025. Push notifications and native ads are critical for driving sales and user engagement in this sector.

The health and fitness app market is projected to generate substantial revenue through in-app purchases and ads. While specific ad revenue figures are less frequently reported, the overall wellness app market is expected to reach $14 billion by 2026, with ads playing a vital role in monetization.
Interested in developing an app for your business or a hobby, but costs have frozen you up? Sometimes, you develop a killer concept but don’t have the funds (at least 800 dollars or more) to implement it. In these cases, 1F Cash Advance can come in handy sometimes. Whether it is for developing, marketing, or to get some basic elements up and running- this can bring things to life. Who cares if money is tight right now? You should not let this stop you from doing something great.
As of 2024, the global mobile gaming market has reached impressive heights, generating approximately $90 billion in revenue in 2023. This figure accounts for about 49% of the total gaming market, valued at $184 billion.
Projections indicate that the mobile gaming market will continue to grow, potentially reaching $118 billion by 2027. Regarding revenue breakdown by platform, the iOS App Store is expected to surpass $40 billion in mobile app revenue. In comparison, Google Play’s mobile game revenue is projected to be around $30 billion in 2024.
User engagement remains robust, with reports showing that 56% of mobile gamers play games more than ten times each week, highlighting the addictive qualities of mobile gaming. The growth of the mobile gaming sector can be attributed to several factors, including advancements in gaming technology, such as enhanced visuals and gameplay mechanics, as well as the rising popularity of e-sports.
————————————————————————————————————————

With over seven years at the forefront of programmatic advertising, Aleesha is a renowned Ad-Tech expert, blending innovative strategies with cutting-edge technology. Her insights have reshaped programmatic advertising, leading to groundbreaking campaigns and 10X ROI increases for publishers and global brands. She believes in setting new standards in dynamic ad targeting and optimization.
10X your ad revenue with our award-winning solutions.