This post was most recently updated on January 5th, 2025
Troubleshooting ad serving and delivery should not be a daunting task. When something breaks, there has to be something that tells you exactly what is going on and how to fix it. In fact, a good tool not only tells you when something goes wrong but warns you beforehand.
Below we provide you with a guide on how to diagnose ad-serving issues and the best tools to use:
While the webpage you are troubleshooting is open, you can load devtools by a keyboard shortcut CTRL+Shift+C or simply hitting the F12 key.

The Elements tab opens if using CTRL+Shift+C.

F12 key opens the Console tab.
HAR (HTTP Archive) is a file in JSON object format with a particular field distribution, used by several HTTP session tools to export the captured data (source: https://toolbox.googleapps.com/apps/har_analyzer/). There will be times when Google support would ask for this file to assist them in troubleshooting.
Be careful with this file as it contains sensitive information:
If Google publisher support asks for a HAR file, here’s how to export it:
Step 1: Open DevTools
Step 2: Go to the Network tab
Step 3: Right-click on any of the contents
Step 4: Save all as HAR with content
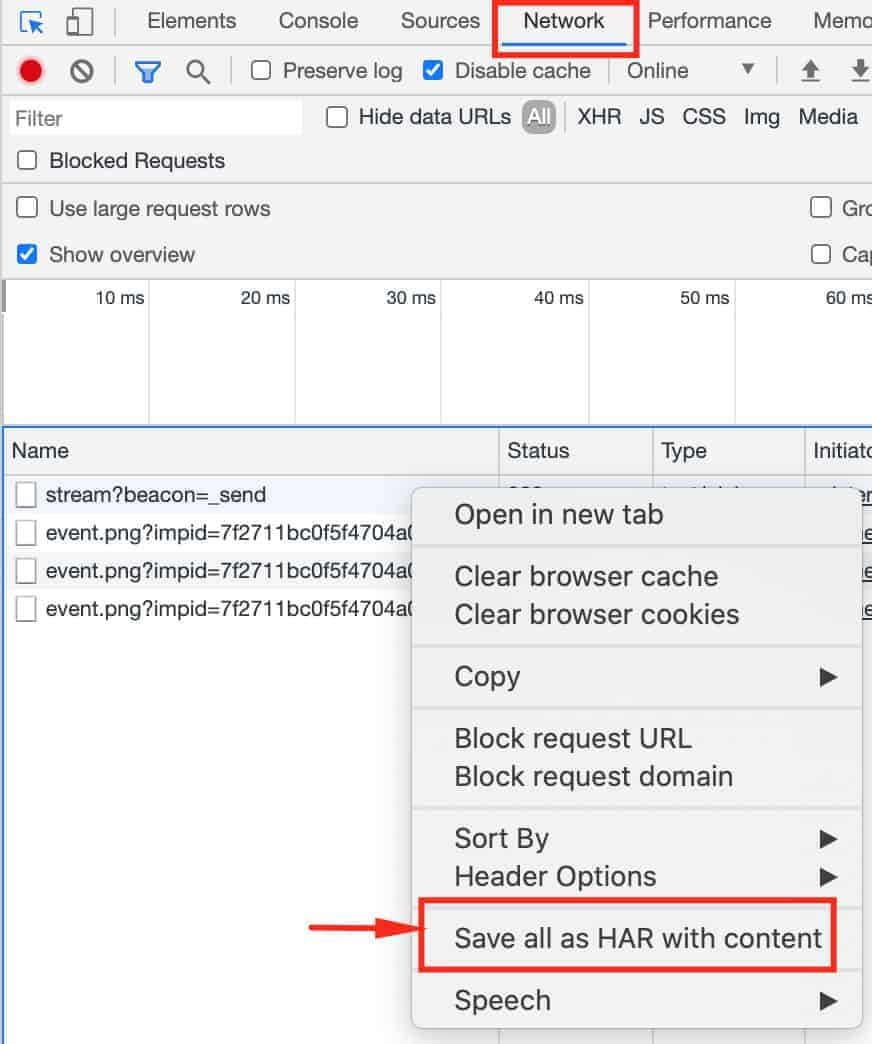
Step 5: Select a folder
Step 6: Save
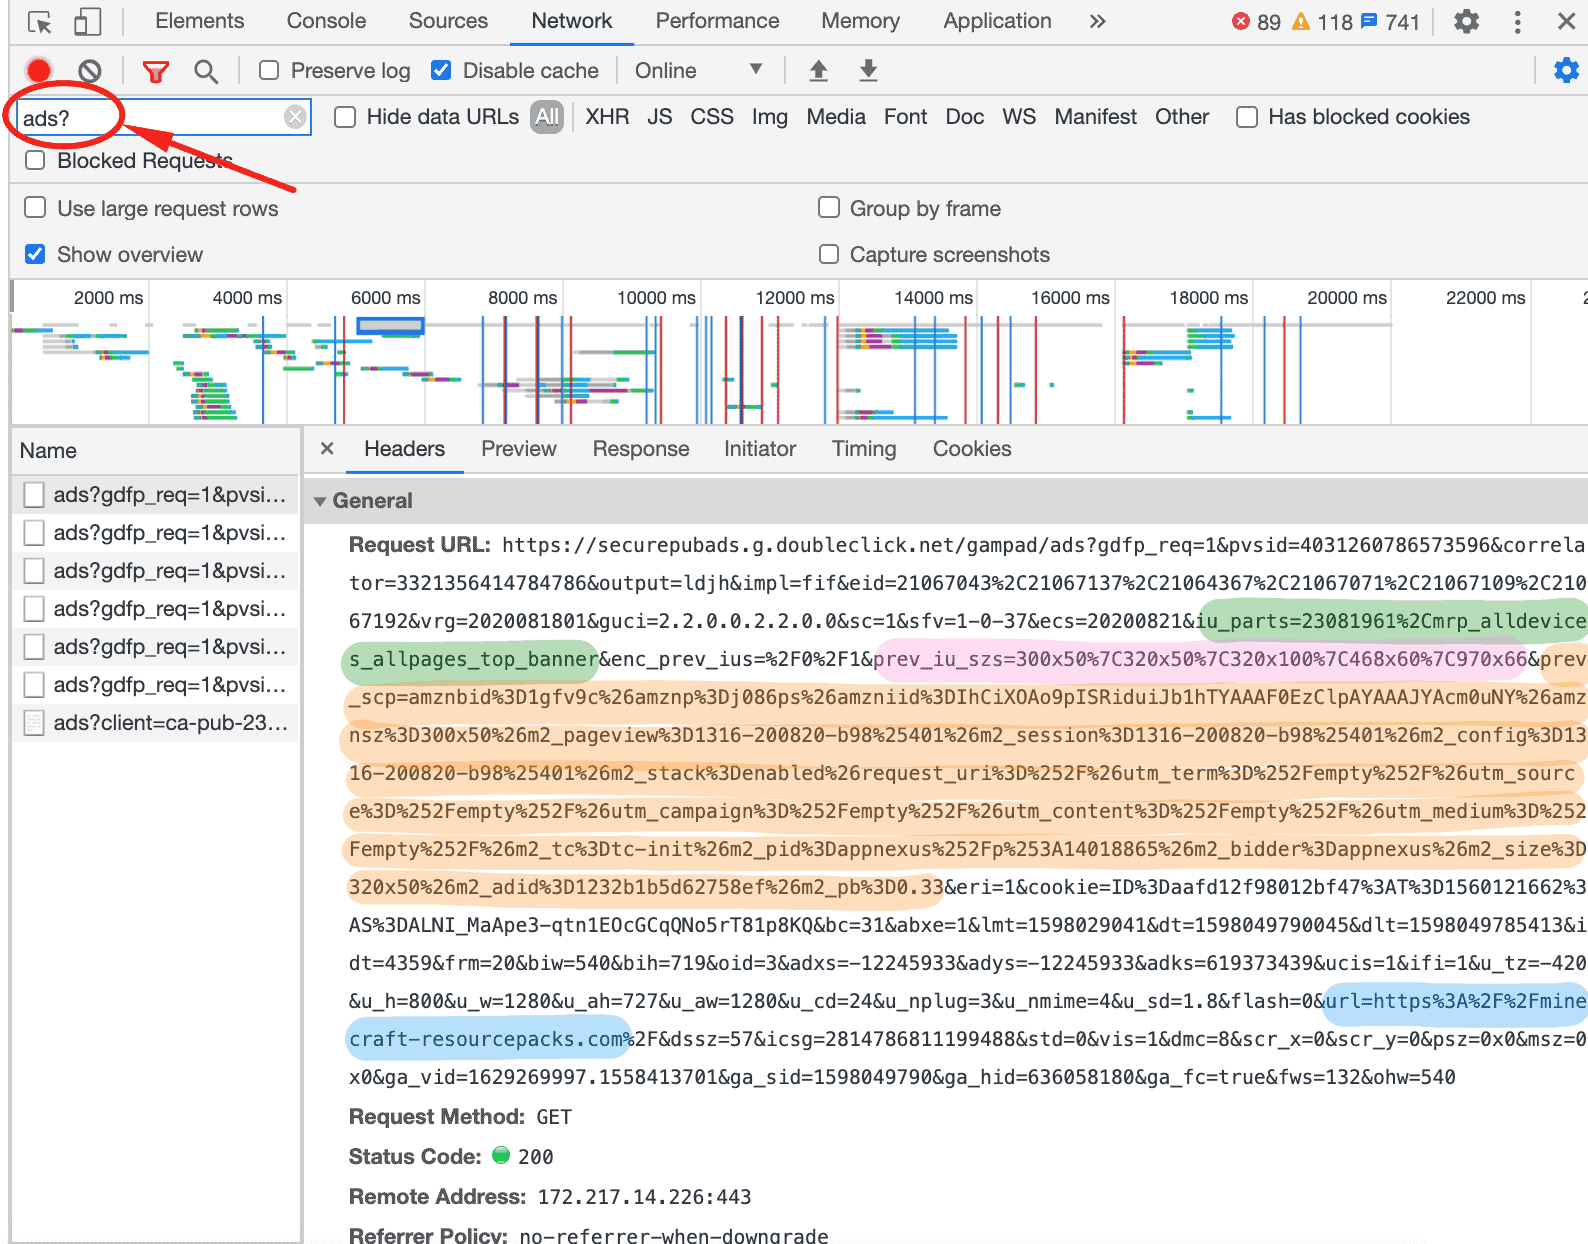
Search for ads? in the Network tab. Ad request calls are those that start with https://securepubads.g.doubleclick.net in the request URL. Important values to check are the following:
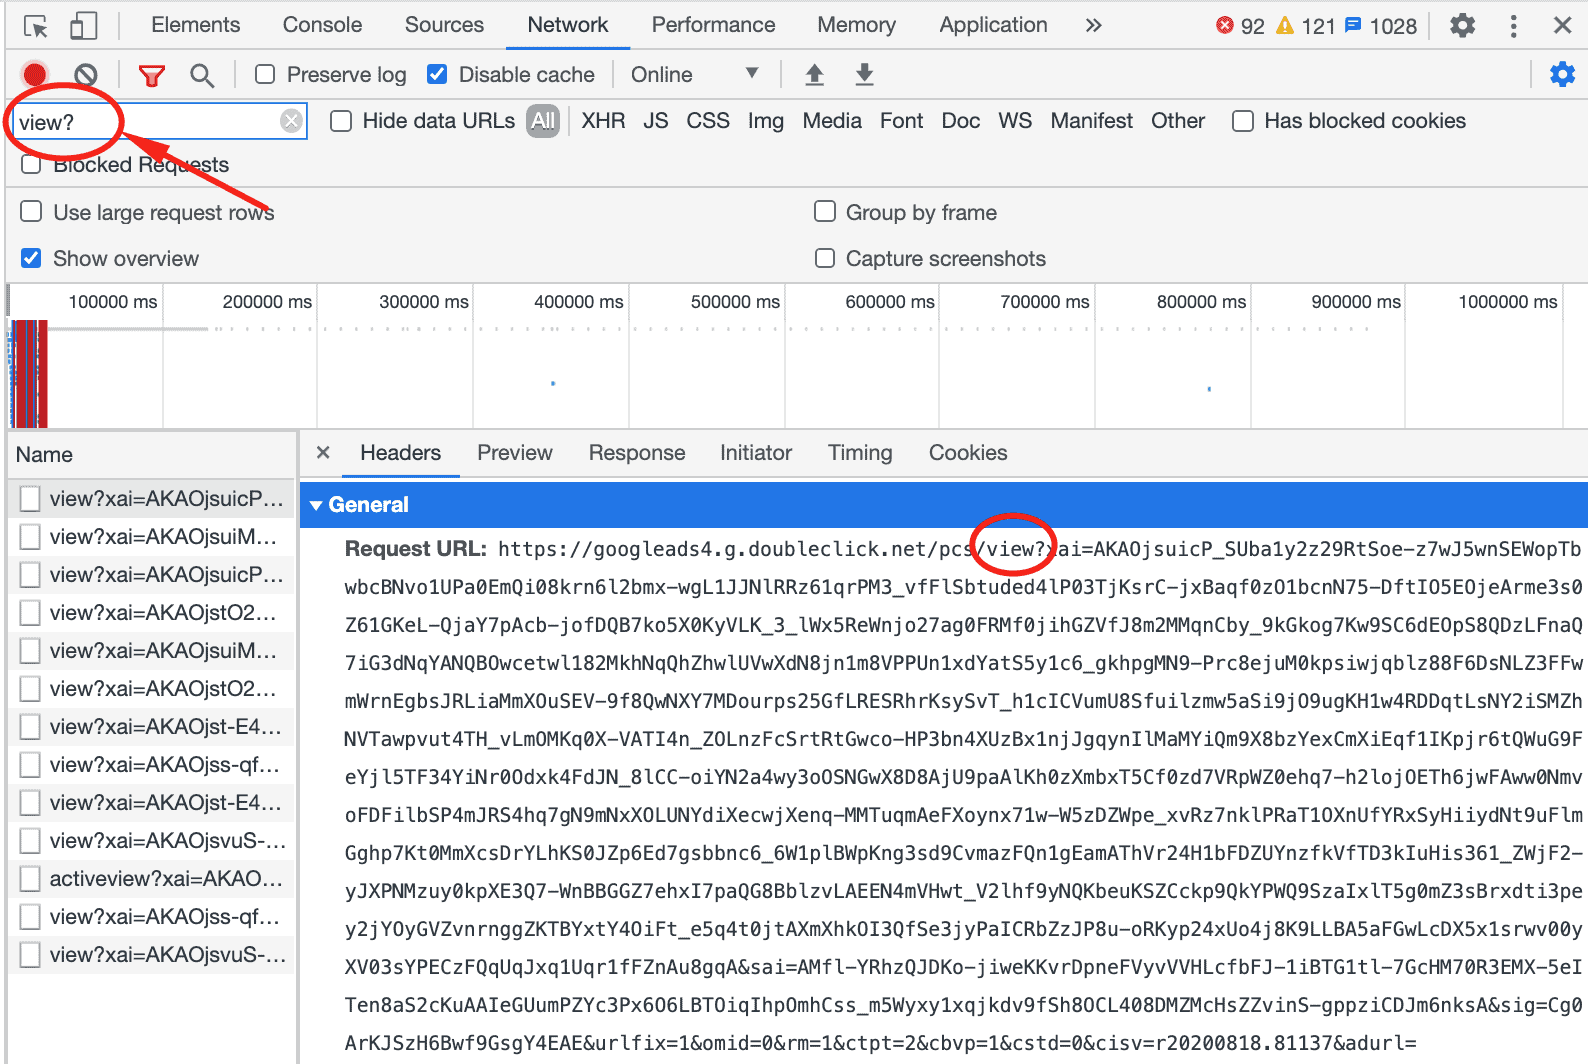
Filter or search for view? in the Network tab. This allows you to verify if impressions are firing and accounted for.
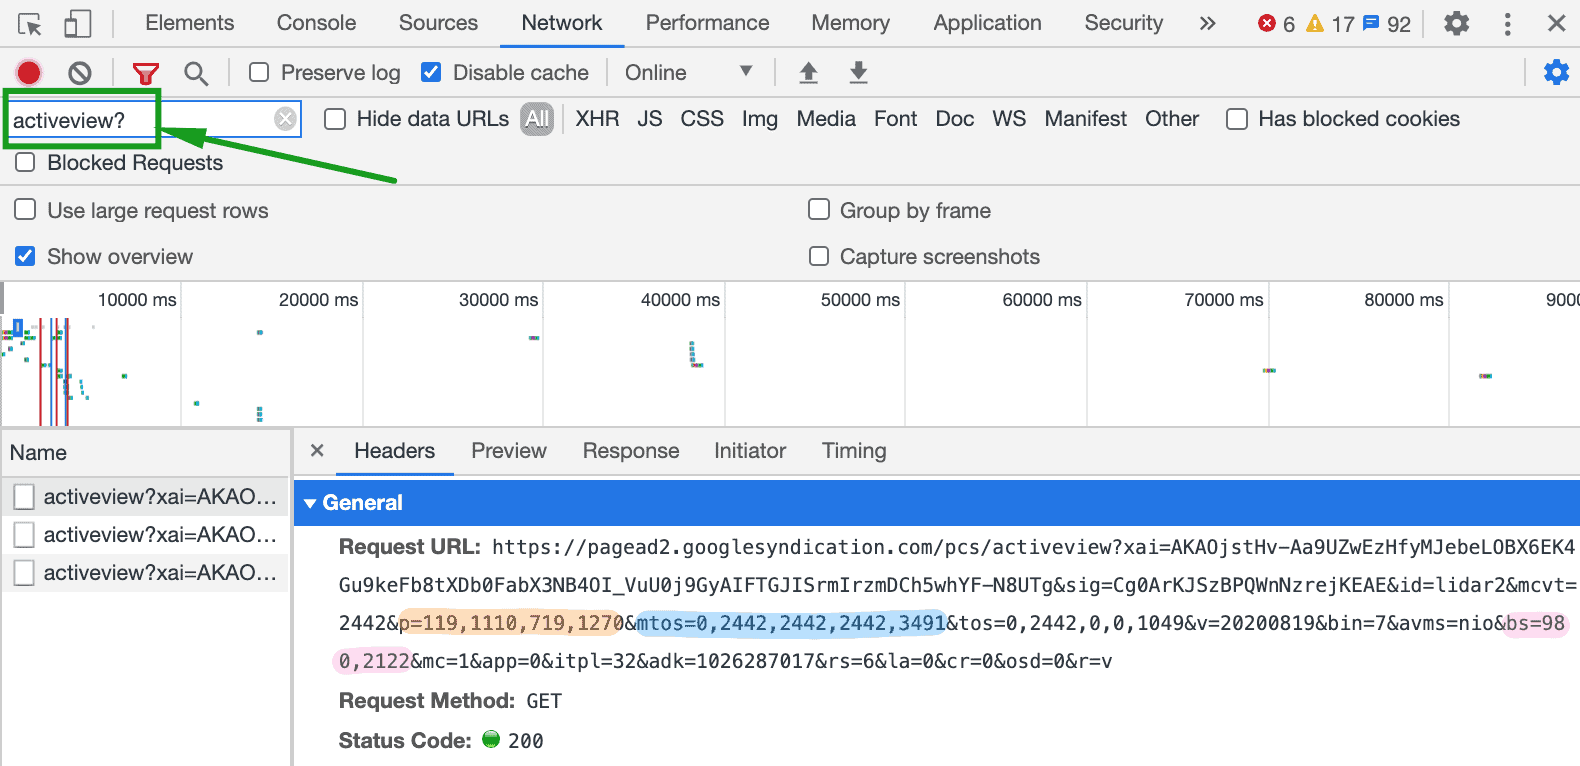
Search for activeview? in the Network tab. Important values to check are the following:
You can find more information here.
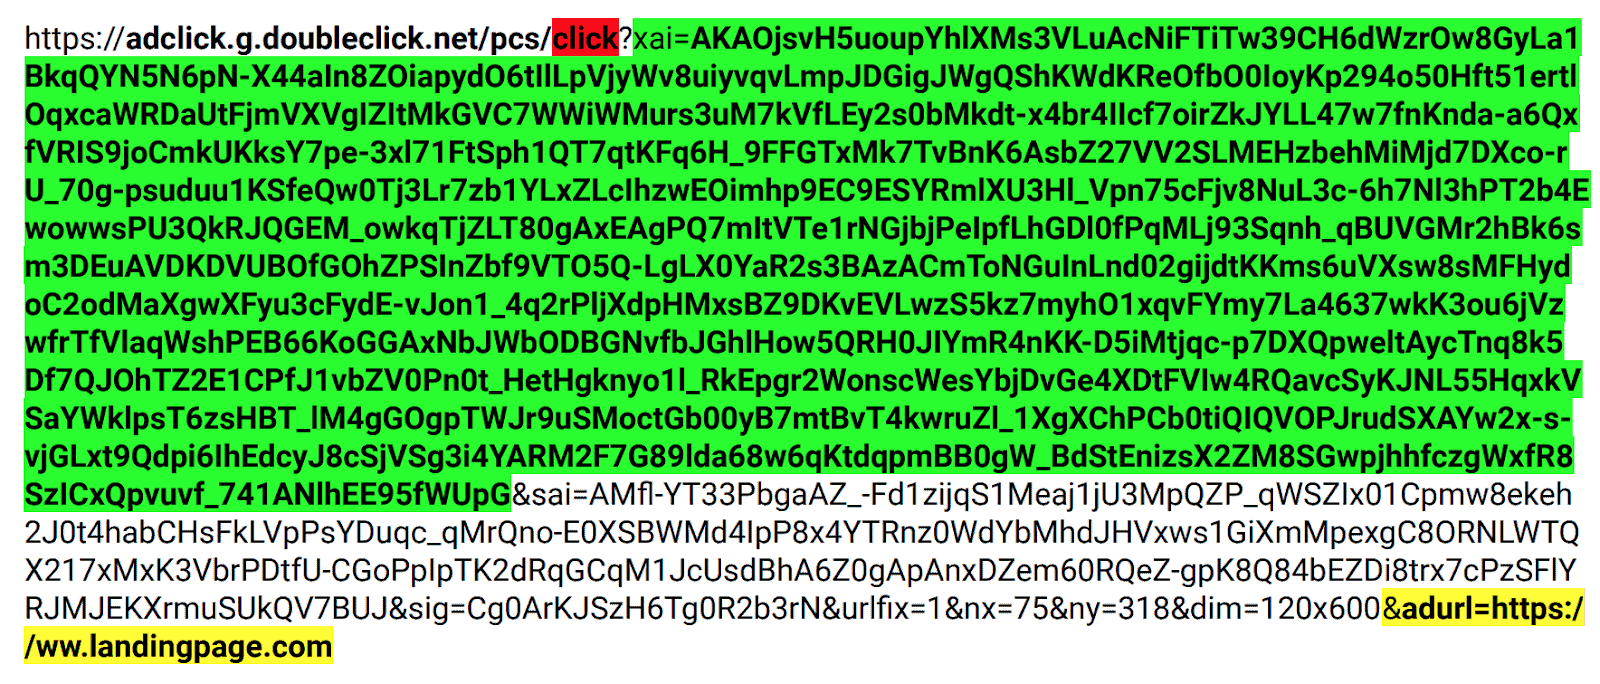
Source: Google
Search for click? in the Network tab. This is to check if clicks are firing and if multiple click pings are being fired which could lead to discrepancies or inaccurate reporting. Important values to check:
The Publisher Console is a handy tool from Google that allows you to understand webpages’ ad requests, winning line items, and underlying tagging mechanisms.
The simplest way to activate it is by appending the URL with ?google_console=1. You may also type in javascript: googletag.openConsole() on DevTools’ Console tab.
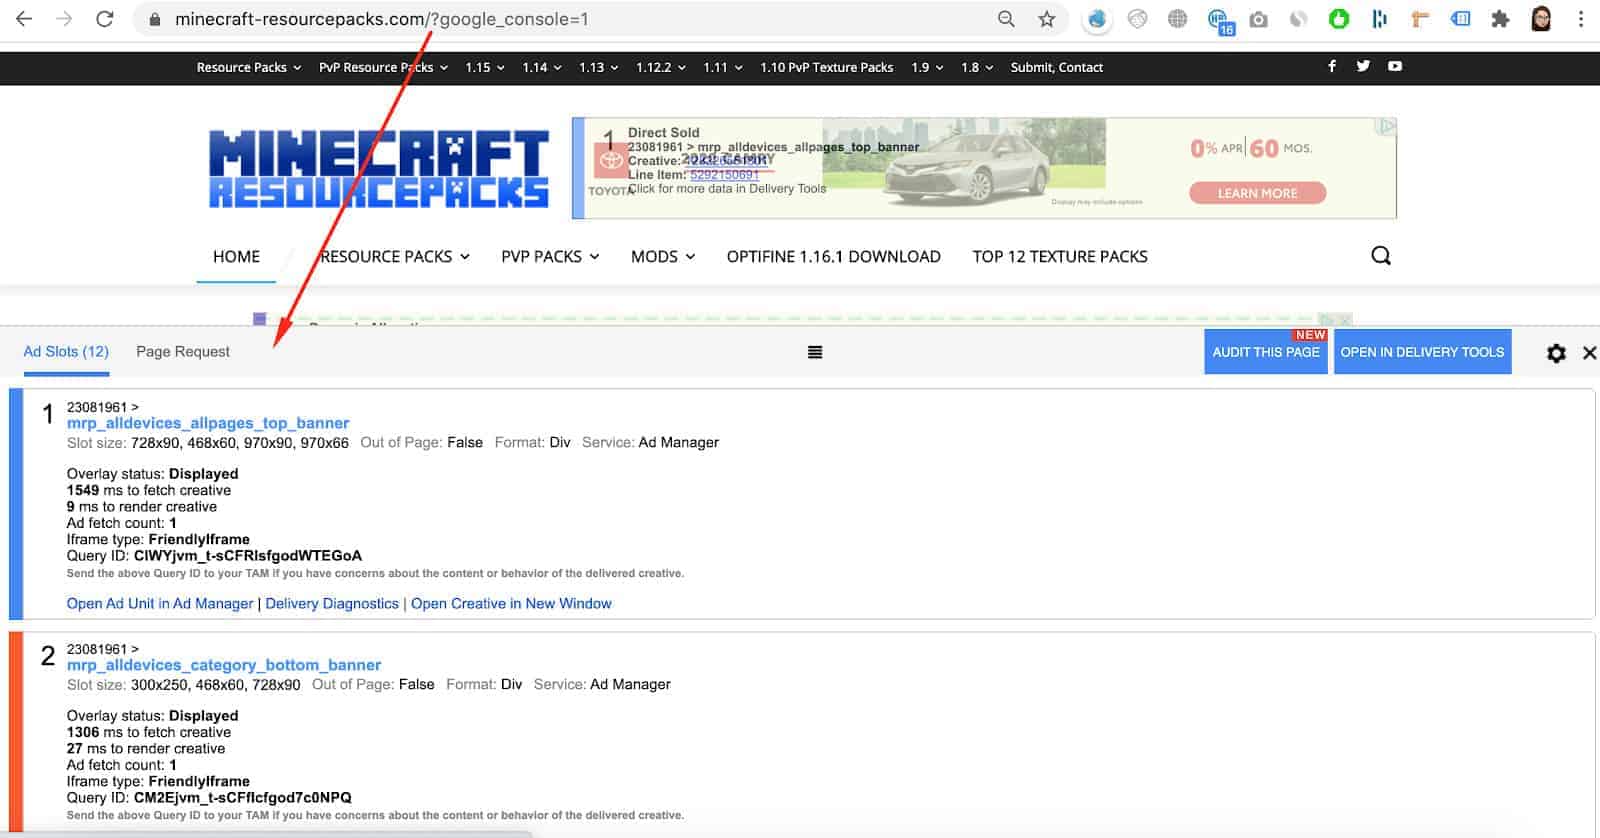
Once activated, use Ctrl+F10 (Windows) and Fn+CTRL+F10 (Mac) to open/close the Console.
Ad Slots tab provides information about the ads, line items, and creatives served on-page.
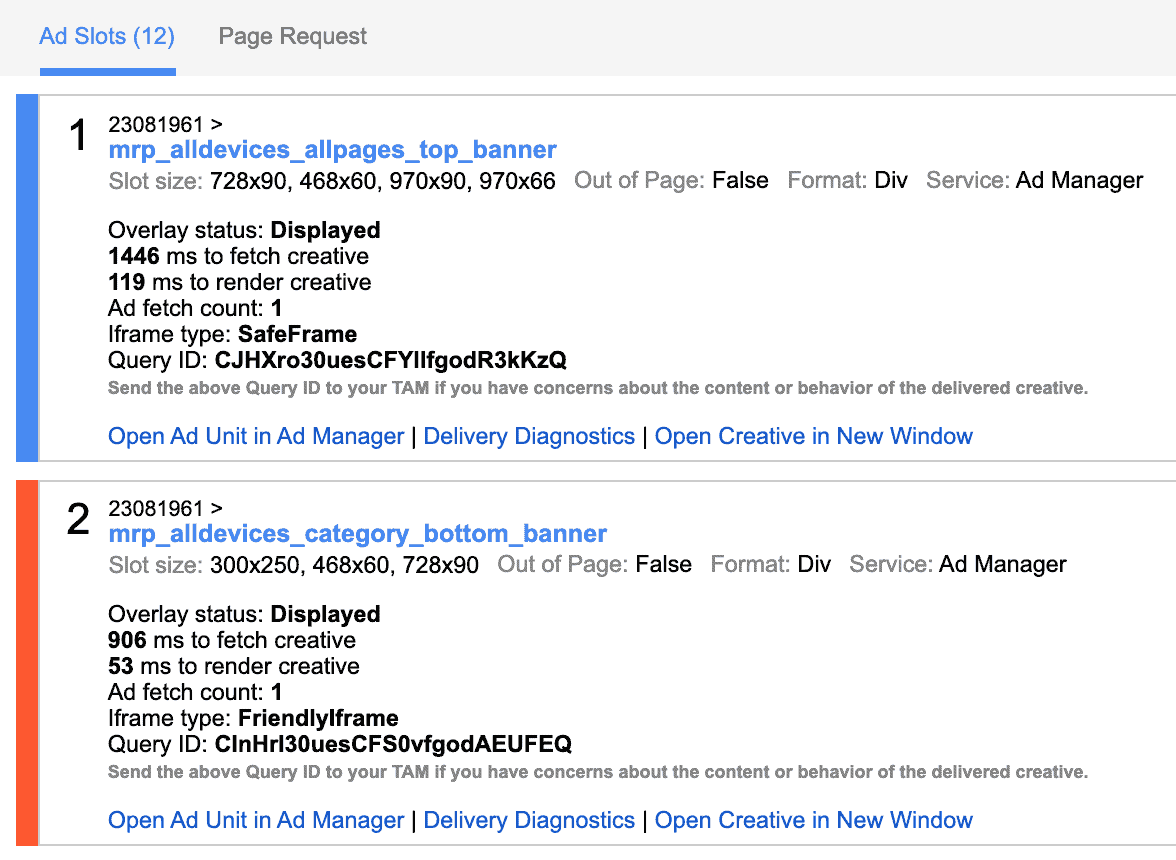
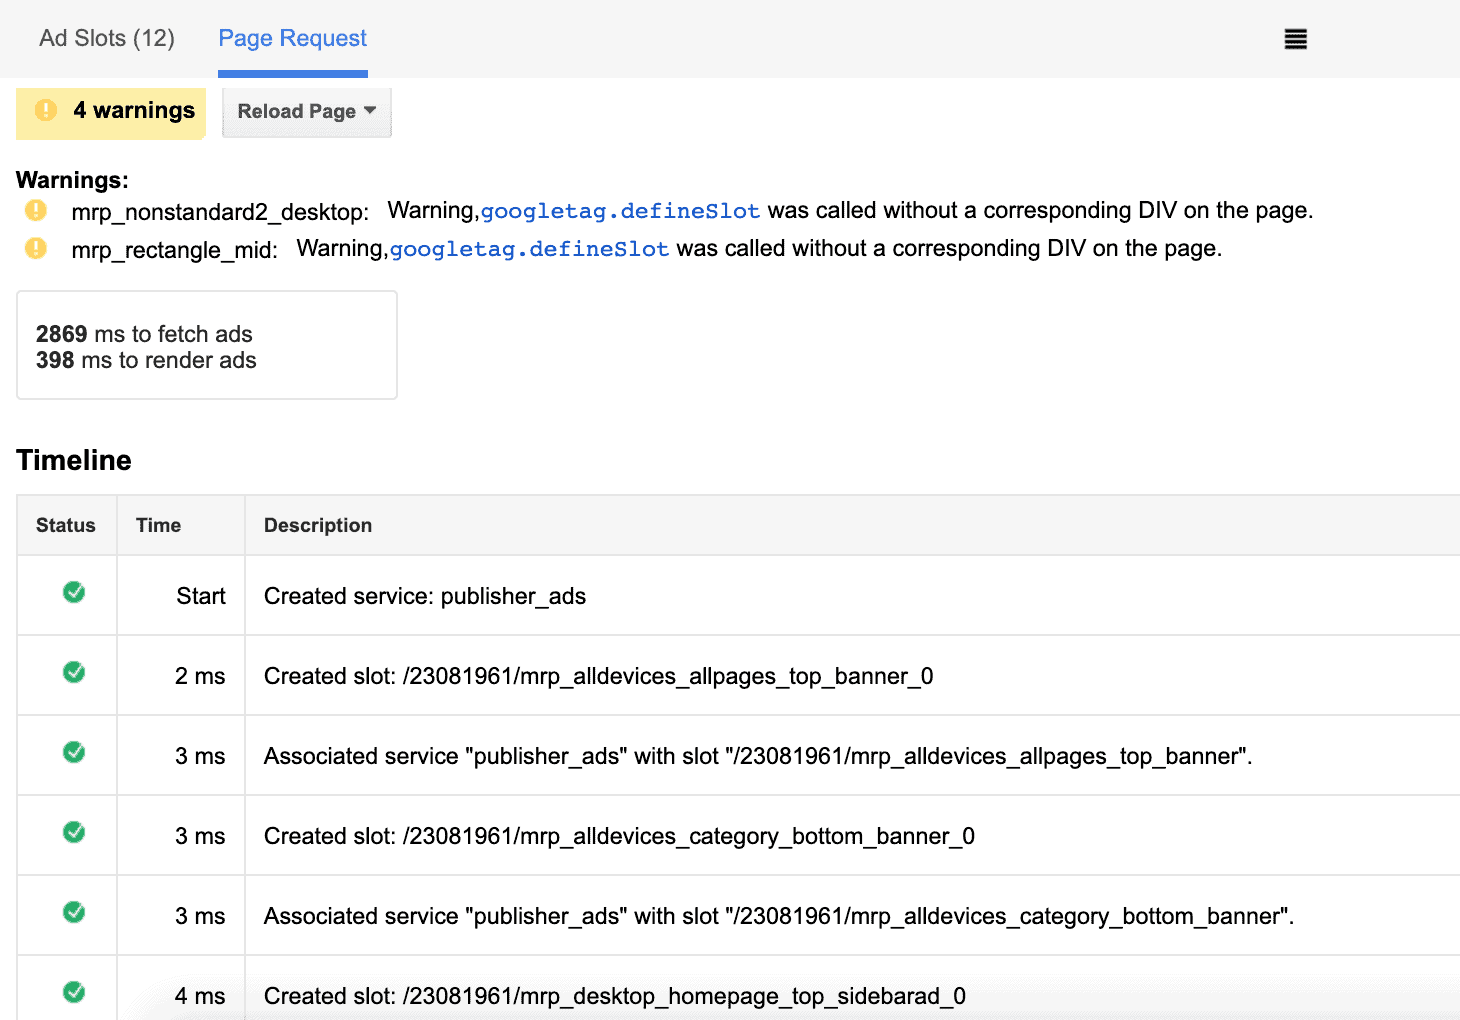
Page Request tab helps you understand page requests and their mechanisms.
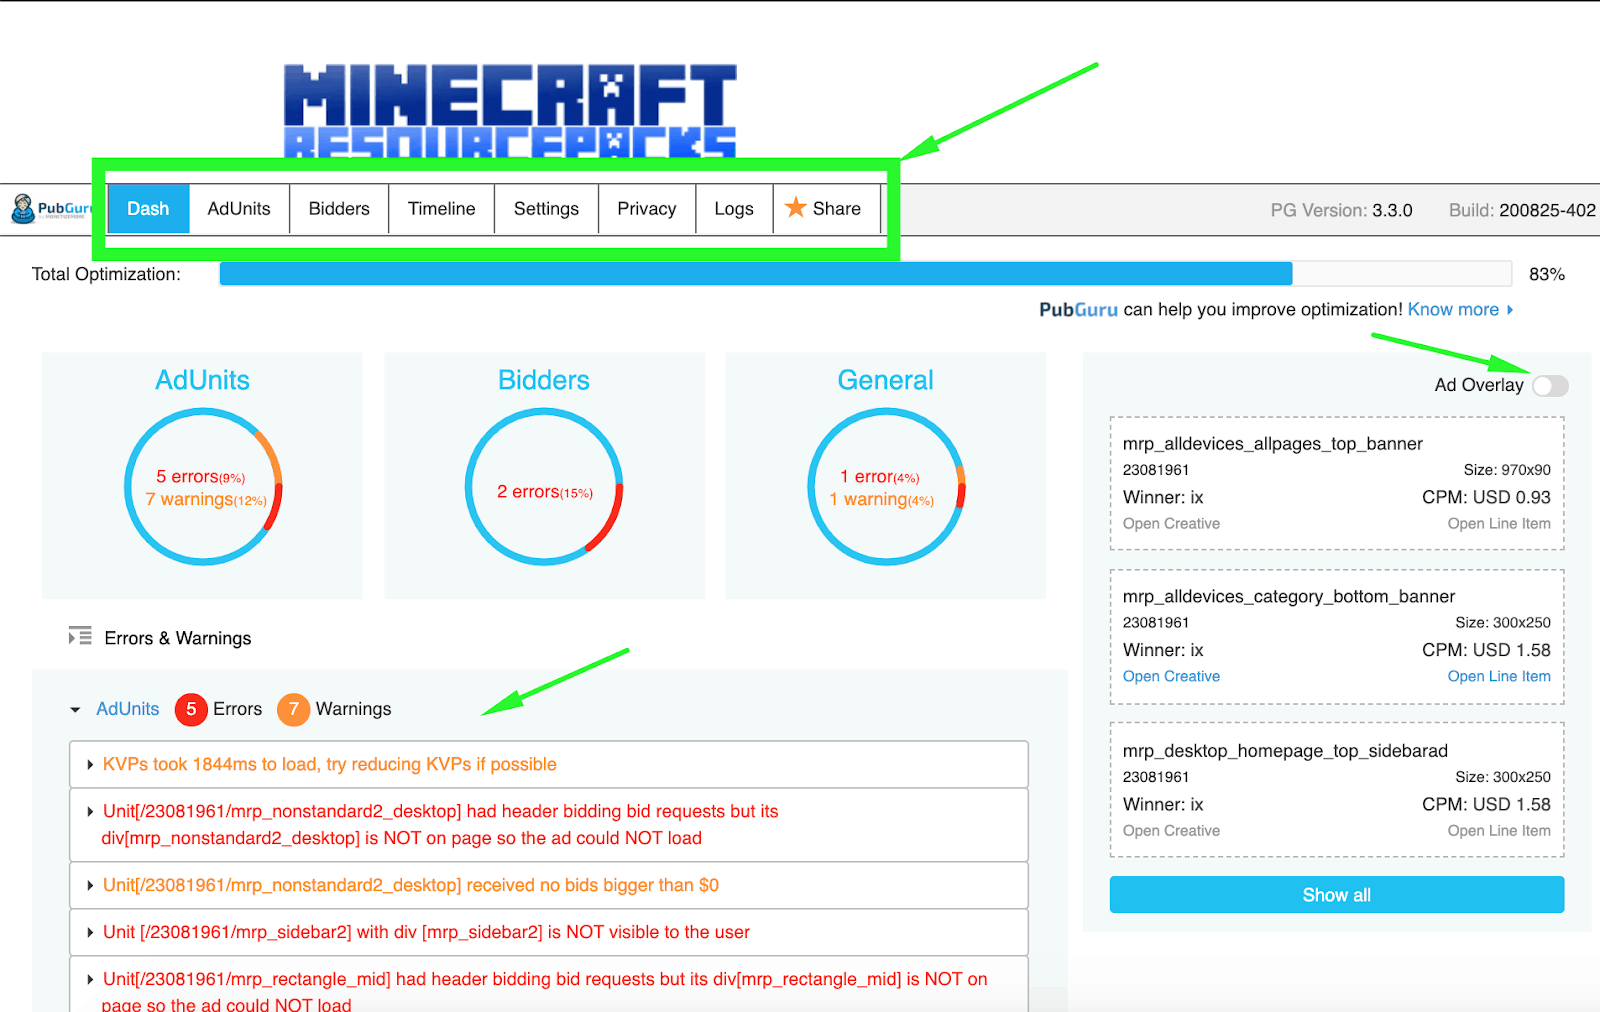
PubGuru Ad Inspector is a Chrome extension with more sophisticated checks and features, making it the troubleshooting tool of choice for publishers. It can run on any device regardless of the screen size. It can diagnose issues with Header Bidding and Google Ad Manager providing clear actionable advice on errors, warnings, and passes.
Download it from here.
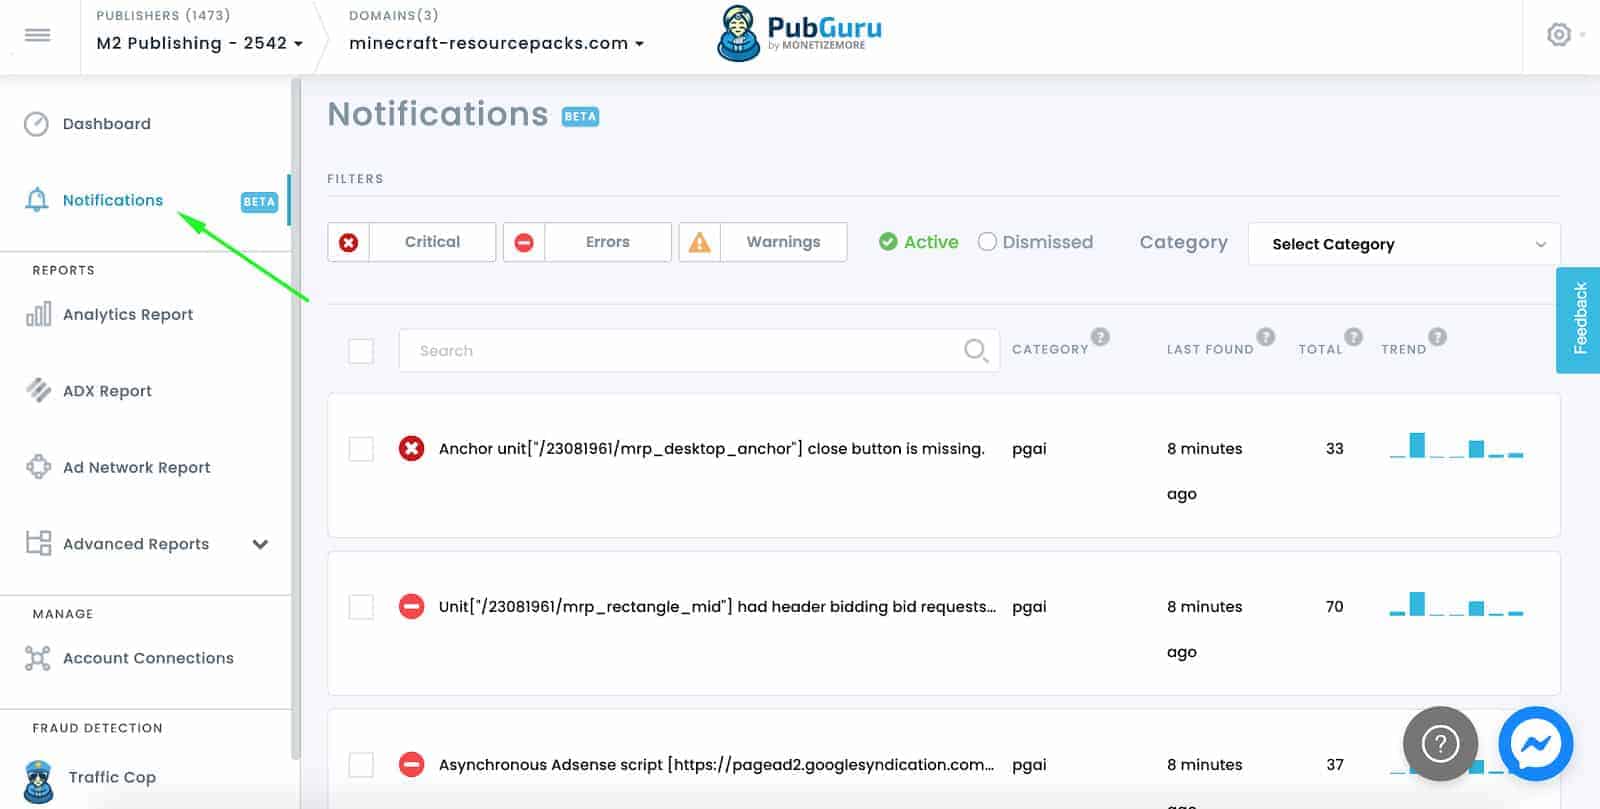
When you sign up with PubGuru, you’ll get Smart Notifications, which means you get notified in real-time when something goes wrong saving you time from having to manually check the site every so often.
Need help? We can take care of the troubleshooting for you. Get started here!

With over ten years at the forefront of programmatic advertising, Aleesha Jacob is a renowned Ad-Tech expert, blending innovative strategies with cutting-edge technology. Her insights have reshaped programmatic advertising, leading to groundbreaking campaigns and 10X ROI increases for publishers and global brands. She believes in setting new standards in dynamic ad targeting and optimization.
10X your ad revenue with our award-winning solutions.