Sign up today and see the results for yourself!
Want to speed up your verification process?
Share a screenshot of your ad revenue from the past 3 months.
This post was most recently updated on September 14th, 2021
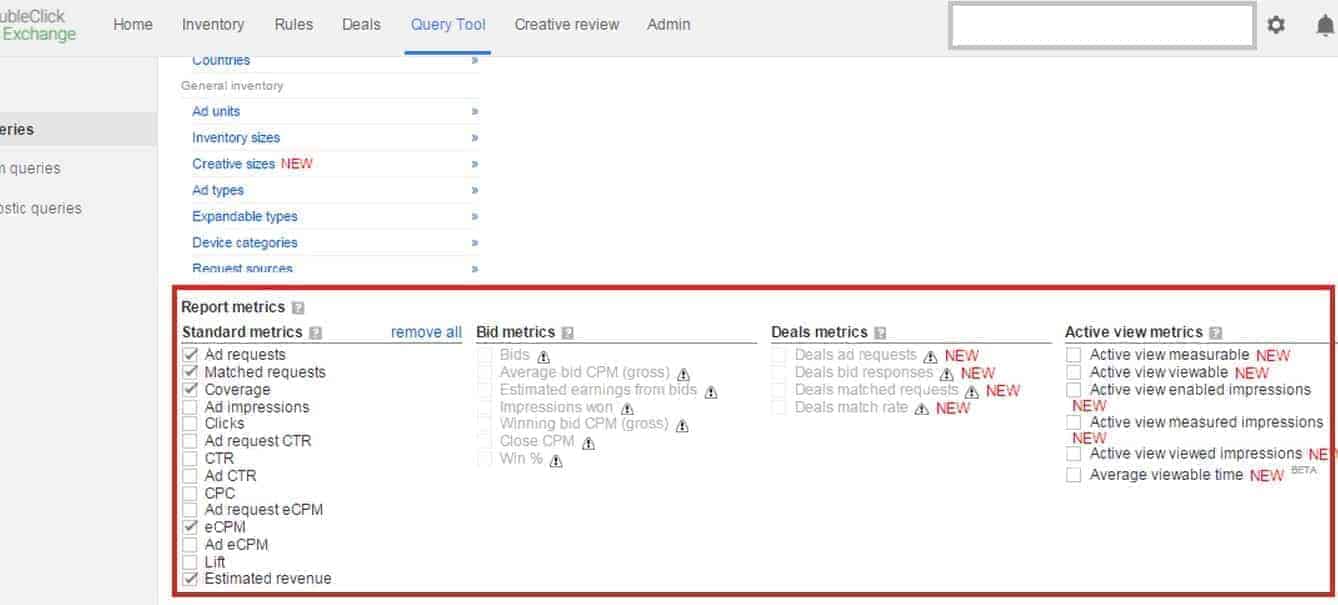
We are all aware that Google has their way of providing a wide range of reports consisting of industry trends performance metrics and benchmarks that accompany Ad Exchange. Today, we’ll review the vital metrics that most of the publishers need and why each report is important. One thing to bear in mind is to understand your campaign goals and use the appropriate metrics to reach them.

The following is a list of the metrics that tend to be the most useful to publishers.
Impressions – total impressions delivered by Ad Exchange.
Clicks – total clicks delivered by Ad Exchange.
Click through rates (CTR) – the percentage of impressions served by Ad Exchange that resulted in users clicking on an ad. It is calculated as Ad Exchange clicks/Ad Exchange impressions) x 100. CTR is important because it measures how visitors initiated an action in an advertisement.
Ad requests – the number of times an ad appears on your website.
Ad request eCPM – ad request per thousand impressions.
Matched requests – the number of ad units or search queries that showed ads.
Ad request CTR – the number of clicks divided by the number of ad requests.
Cost per click (CPC) – the amount a publisher earns each time a user clicks on an ad. It’s calculated as Estimated revenue/number of clicks received. This metric is also an indicator as an advertisement displays when a keyword query matches an advertiser’s keyword list or when a content site displays a relevant content.
eCPM – the total number of effective cost-per-thousand-impressions. This is important because this measures the efficacy of your campaigns and advertisements.
Ad Exchange average eCPM – the average effective cost-per-thousand-impressions earned from the ads delivered by Ad Exchange through line item dynamic allocation.
Lift – how optimization effectiveness is measured. Zero/ negative lift means that the system cannot optimize the ads effectively. Make sure to keenly look at this metric once in a while.
Ad Exchange revenue – this is the revenue generated from the Ad Exchange through line item dynamic allocation, calculated in your network’s currency and time zone.
Estimated revenue – Net revenue generated from ad impressions served (with adjustments for ad spam and other factors).
1) Bid Metrics
2) Active View Metrics
Your defined campaign goals will direct you to the appropriate and important metrics that you need to reach. Keep in mind that success differs from advertiser to advertiser and from campaign to campaign. Understanding Ad Exchange’s goals and metrics can be tough. At MonetizeMore can help you understand, define, and hit your campaign goals. We can help you take your ad revenue to the next level! Try a smater reports by PubGuru today
Related Reads:
10X your ad revenue with our award-winning solutions.